
A massive thank you to all of those who have submitted their response to the Annual Museum Survey 2020!
An incredible 42% of museums contacted across the South West have already submitted their return for the Annual Museum Survey 2020. A further 19% of museums are currently working on their returns.
For those of you who have not yet submitted….
We appreciate that you are facing wider challenges this year due to COVID-19. If you are yet to start your response, have not received your invite or have questions about the survey please do get in touch via [email protected] by Friday 9th October to give you as much time as possible to complete your return before the 18th October deadline.
We are here to assist in your return and keen to ensure that we capture the most complete picture about museum activity in your area.
Responses so far
We wanted to say ‘Thank you’ to those that have submitted their response and to those who are still working on their return. We have had a great response rate so far from museums in the South West and below we wanted to showcase the museums who have submitted so far.
Our Data and Research Assistant, Rowan, created these infographics to celebrate the museums who have responded so far. The size of text in each of the below images was allocated randomly and we appreciate the contribution of each, equally.
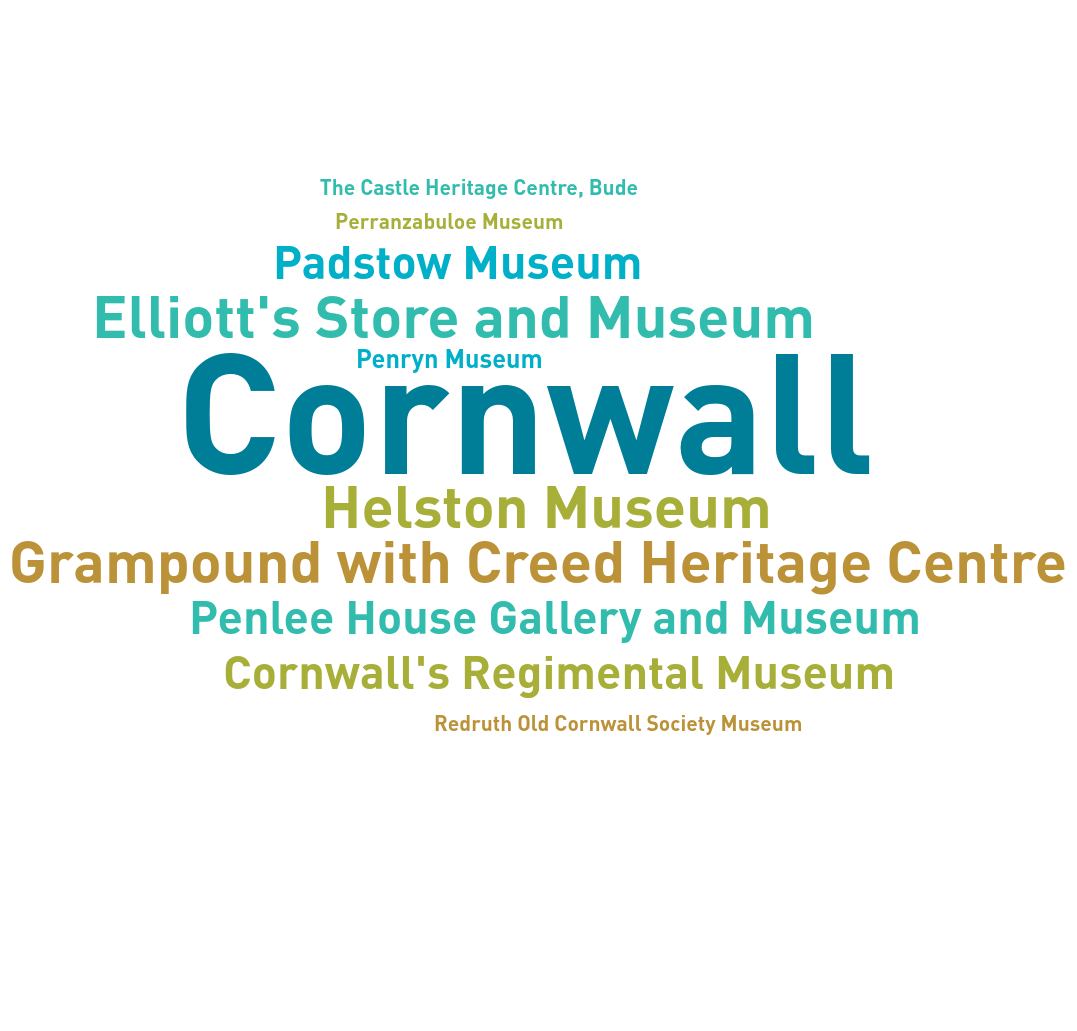
Download the Cornwall infographic (PNG) to see the Cornwall museums who have contributed so far, in a larger size.
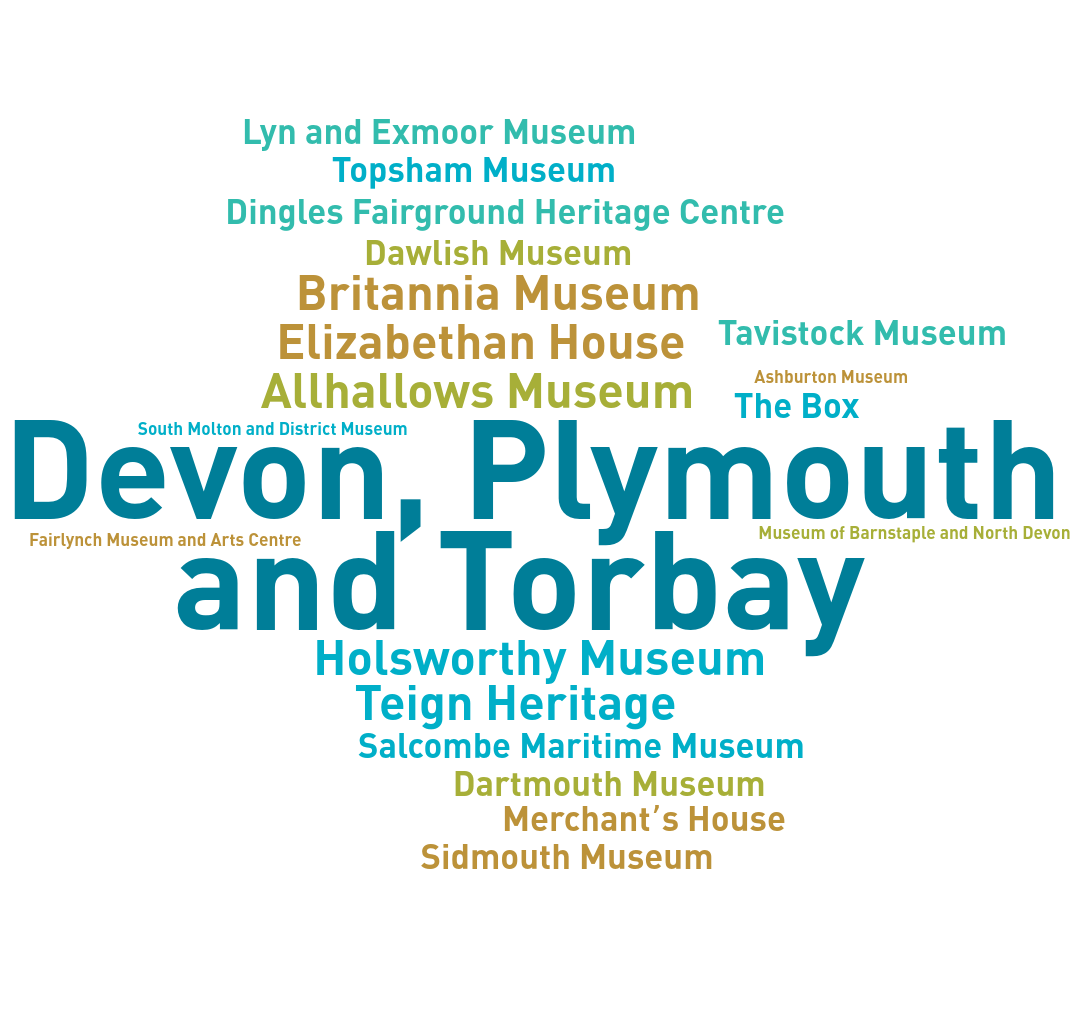
Download the Devon, Plymouth and Torbay infographic (PNG) to see the Devon, Plymouth and Torbay museums who have contributed so far, in a larger size.
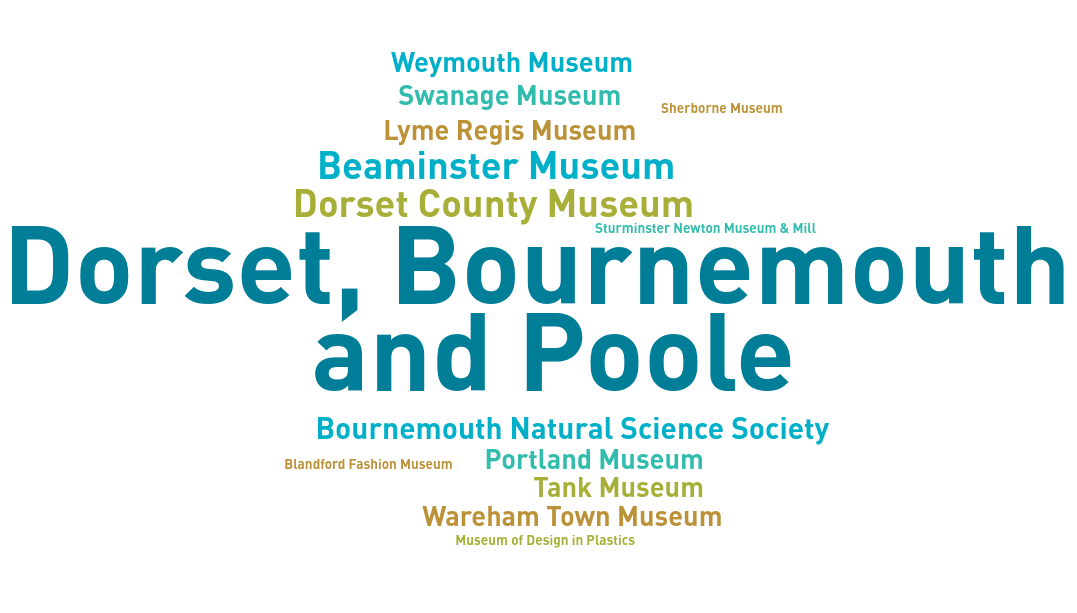
Download the Dorset, Bournemouth and Poole infographic (PNG) to see the Dorset, Bournemouth and Poole museums who have contributed so far, in a larger size.
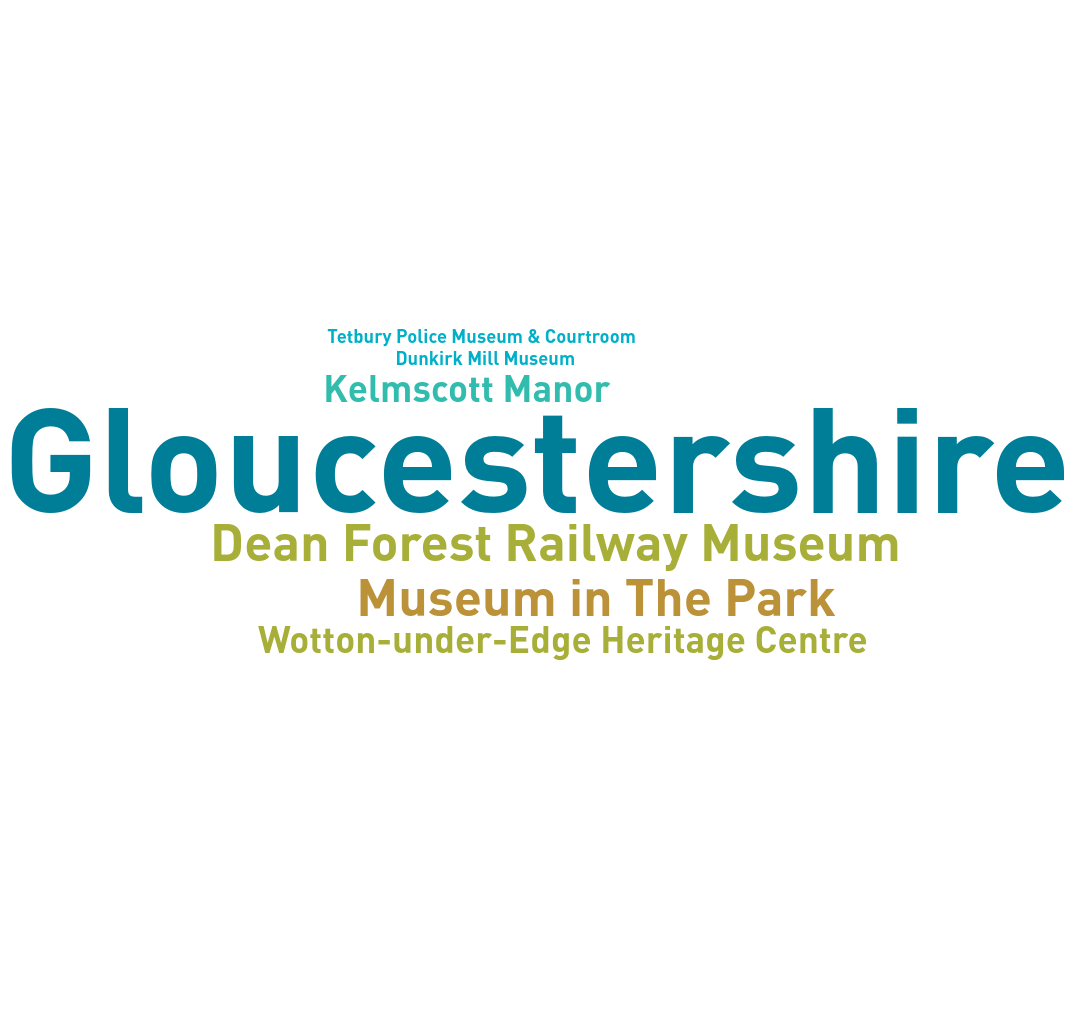
Download the Gloucestershire infographic (PNG) to see the Gloucestershire museums who have contributed so far, in a larger size.
Download the Somerset infographic (PNG) to see the Somerset museums who have contributed so far, in a larger size.
Download the West of England infographic (PNG) to see the West of England museums who have contributed so far, in a larger size.
Download the Wiltshire infographic (PNG) to see the Wiltshire museums who have contributed so far, in a larger size.
You can also download the full list (PDF) of museums who have responded.
Your Annual Survey data
The data we collect this year will help us understand the impact of the pandemic on the sector both in the South West, and nationally through the Annual Museum Surveys we are running across the nine Museum Development regions across England.
The reports generated can also be used by participants and by Local Authorities for benchmarking, advocacy purposes and in funding applications.
If you are a museum who has not signed up this year but interested in this work, please do get in touch.
The information above and in the images is correct as of 01/10/20.