Annual Museum Survey 2021 - England
Read more about our work delivering the Annual Museum Survey for regions across England.

The Annual Museum Survey 2021 South West compares data with previous years to understand the depth of the Covid-19 impact and the pressures it has placed on the museum sector in the region.
Each year we launch a survey in the South West, asking museums within the Accreditation scheme to provide core data on:
This data helps to prove the social and economic value of museums across the South West, both locally and regionally. It also helps museums to benchmark their work.
By encouraging museums and heritage organisations to adopt a simple and uniform way of reporting their headline operational data, we have collated a dataset that will enable museums to compare and benchmark themselves anonymously and confidentially to others in the museum sector.
Our surveys allow us to monitor the impact of Arts Council England investment in the museum and heritage sector in the South West, and to advocate to funding bodies and government to sustain investment in the sector.
Having trouble viewing the interactive report? View the Annual Museum Survey 2021 South West in a separate tab, or contact us at [email protected] to access the report in an alternative format.
For national results, please read the Annual Museum Survey 2021 national report.
Read the interactive report below. Move your mouse over or click through tabs to view different analysis.
Read the interactive report below. Move your mouse over or click through tabs to view different analysis.
Having trouble viewing the interactive report? View the Annual Museum Survey England 2020 in a separate tab or contact us at [email protected] to access the report in an alternative format.
The below data is from our 2018 – 2019 survey and each section is a PDF available for download:
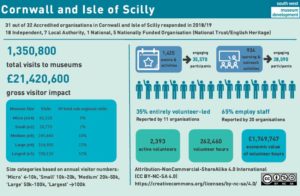
There were over 1.35 million visit to museums in Cornwall, equating to £21 million gross visitor impact. There were 1,425 events and activities engaging a reported 35,570 participants.
Download the Cornwall and Isles of Scilly PDF to view more information about Cornwall and Isle of Scilly museums.
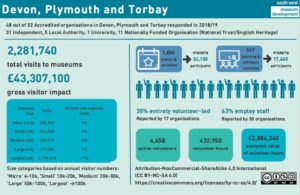
There was a reported 4,458 active volunteers in museums in Devon, Plymouth and Torbay, with a total 433,000 volunteer hours. Visitors brought in a reported £43 million in gross visitor impact.
Download the Devon, Plymouth and Torbay PDF to see more information about Devon, Plymouth and Torbay museums.
19 museums in Dorset, Bournemouth and Poole reported they were independent, reporting over £22 million gross visitor impact from 1.08 million visitors. Learning and outreach activities in the region engaged 21,460 participants.
Download the Dorset, Bournemouth and Poole PDF to uncover more about Dorset, Bournemouth and Poole museums.

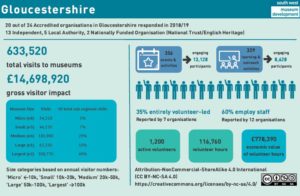
There were a reported 1200 active volunteers in Gloucestershire museums, reporting 116,760 volunteer hours, equating to an economic value of £778,390. There were also 633,520 total visits to museums.
Download the Gloucestershire PDF to view more about Gloucestershire museums.
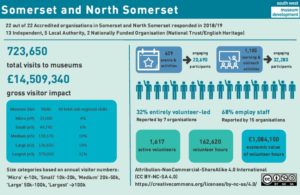
In Somerset and North Somerset, museums reported a gross visitor impact of over £14 million. They reported 629 events and activities, engaging 20,690 participants. Volunteers in the region had an economic impact of £1,084,150.
Download the Somerset and North Somerset PDF to see more about Somerset and North Somerset museums.
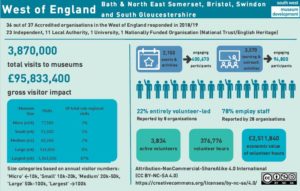
There were 3.87 million visits to 37 participating museums in the West of England, creating a £96 million gross visitor impact. A reported 87% of visits were in the the ‘largest’ museums. Museums reported a total of 400,670 participants engaging in 2,150 events and activities.
Download the West of England PDF to view more information about West of England museums.
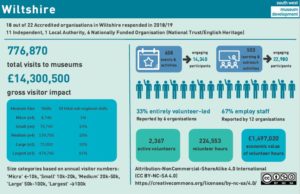
There were a reported 776,870 visits to museums in Wiltshire. A total of 6 museums in Wiltshire reported to be entirely volunteer led, with the region reporting 2,367 active volunteers, with an economic impact of £1,497,020.
Download the Wiltshire PDF to see more information about Wiltshire museums.
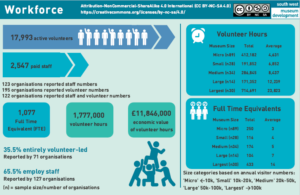
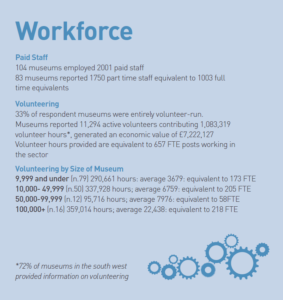
There are 17,993 active volunteers in museums in the South West (*reported by 195 organisations), with 35.5% of our museums being entirely volunteer led
Download the Workforce PDF to uncover more information about the museum workforce in the South West.
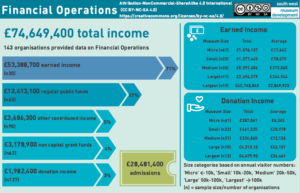
Museums across the South West reported a total income of £74,649,400 in 2018/19, of which £28,481,400 was taken through ticket sales.
Download the Financial Operations PDF to view more 2018 – 2019 date related to the financial operations of museums in the South West.
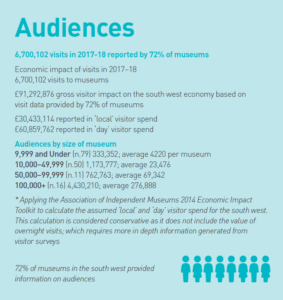
There were over 10.7 million visits to museums in the South West in 2018/19, with total visits worth over £225,000,000.
Download the Audiences PDF to find out more about museum audiences in the South West related to museum size and
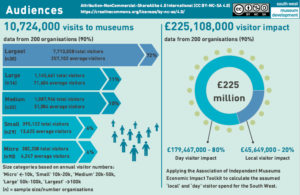
Micro – fewer than 10,000 visitors
Small – 10,000 to 20,000 visitors
Medium – 20,000 to 50,000 visitors
Large / largest – greater than 50,000 visitors
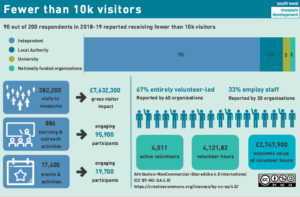 Micro museums overview – audiences of fewer than 10,000 annual visitors
83% of micro museums are independently run. Micro museums engaged over 95,000 participants in learning and outreach activities and held 17,400 events and activities.
Volunteers in small museums reported 191,852 hours, which has an economic value of £1.3 million.
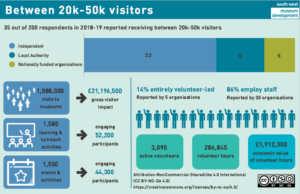
Medium museums had 1,088,000 visits in 2018/19, equating to £21.2 million in gross visitor impact.
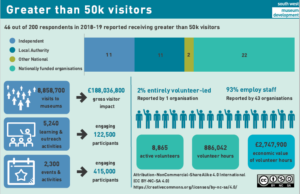
Large museums engaged 415,000 participants through 2,300 events and activities, and reported £188 million gross visitor impact with a total 8,858,700 visits.
The below data is from our 2017 – 2018 survey. Download the document in PDF:
Annual Survey of Museums Highlights 2017-2018
The below data is from our 2016 – 2017 survey. Download the document in PDF:
Download the Annual Survey of Museums 2016-2017
Download the Annual Museum Survey 2020 snapshot for Cornwall below (PDF): If you would like the document in a different format, please contact us at [email protected]. Please see our Accessibility information for further details.
Download the Annual Museum Survey 2020 snapshot for Devon below (PDF):
If you would like the document in a different format, please contact us at [email protected]. Please see our Accessibility information for further details.
Download the Annual Museum Survey 2020 snapshot for Dorset, Bournemouth, Christchurch & Poole below (PDF):
If you would like the document in a different format, please contact us at [email protected]. Please see our Accessibility information for further details.
Download the Annual Museum Survey 2020 snapshot for Gloucestershire below (PDF):
If you would like the document in a different format, please contact us at [email protected]. Please see our Accessibility information for further details.
Download the Annual Museum Survey 2020 snapshot for Somerset below (PDF):
If you would like the document in a different format, please contact us at [email protected]. Please see our Accessibility information for further details.
Download the Annual Museum Survey 2020 snapshot for West of England below (PDF):
If you would like the document in a different format, please contact us at [email protected]. Please see our Accessibility information for further details.
Download the Annual Museum Survey 2020 snapshot for Wiltshire below (PDF):
If you would like the document in a different format, please contact us at [email protected]. Please see our Accessibility information for further details.
Read more about our work delivering the Annual Museum Survey for regions across England.